
Research Report: The Culture Code Cracked -- Unlocking the S&P 500's Sector Leaders Performance Advantage


Author: Gerard F. McDonough, Founder & Managing Director, NextArc Leadership Solutions, LLC
Date: March 2025
Abstract:
This research study, conducted during February and March 2025, investigates the cultural characteristics of eleven highest performing "Benchmark" companies within the S&P 500, each of the eleven Sector leaders, including Nvidia, Tesla, Celsius Holdings, UnitedHealth Group, Mastercard, Builders FirstSource, Netflix, Texas Pacific Land Corporation, Linde plc, Prologis, and NextEra Energy. These companies have demonstrated significant outperformance relative to the broader S&P 500 over the past five years.

Utilizing the proprietary "Culture Performance Index" (CPI), a validated survey instrument, we examined the cultural profiles of these companies, focusing on their "Adaptability" as defined by five competing values continua: Inward vs. Outward, Confrontational vs. Cooperative, Reactive vs. Proactive, Static vs. Flexible, and Monotonous vs. Invigorating.
Results indicate that the Benchmark companies, on average, exhibit significantly higher levels of Adaptability compared to the normative CPI database. These findings suggest a strong correlation between cultural Adaptability and sustained high performance, highlighting the importance of fostering dynamic, external-focused, and employee-centric organizational environments.
1. Introduction:
The relationship between organizational culture and sustained high performance has become a focal point of contemporary management research. This study delves into the cultural dynamics of a select group of S&P 500 companies that have consistently outperformed the market, achieving a cumulative return of 657% compared to the S&P 500's 93% over the past five years. These "Benchmark" companies, the star performers in each of the S&P Sectors, were selected to examine the potential cultural underpinnings of their success.

Our objective was to determine whether these companies possess distinct cultural characteristics that contribute to their exceptional performance. Specifically, we aimed to assess their cultural "Adaptability" using the CPI model, comparing their profiles to the average organizational culture in our normative database of companies. We hypothesize that these companies exhibit a significantly higher degree of cultural Adaptability, characterized by an outward focus, collaborative spirit, proactive approach, flexibility, and an invigorating work environment.
2. Methodology:
2.1. Culture Performance Index (CPI) Model:
The CPI is a validated and reliable measurement model designed to provide a comprehensive assessment of organizational culture. It employs a 12-minute employee survey utilizing a 5-point Likert scale (1 = "Bad", 5 = "Good"), enabling quantitative analysis of qualitative cultural dimensions. The CPI provides a "macroscopic" view of culture by plotting organizations on five competing values continua:
Inward vs. Outward: This continuum measures the extent to which an organization prioritizes internal processes, concerns, and communications vs. understanding and responding to the external environment, including customers, competitors, and market trends. An outward focus signifies a customer-centric and market-adaptive culture.
Confrontational vs. Cooperative: This dimension evaluates the organization's approach to conflict and collaboration. A cooperative culture emphasizes teamwork, consensus-building, and win-win solutions, while a confrontational culture is characterized by competition and assertiveness.
Reactive vs. Proactive: This continuum assesses the organization's approach to change and problem-solving. A proactive culture anticipates future challenges and opportunities, focusing on planning and prevention, while a reactive culture responds to events as they occur.
Static vs. Flexible: This dimension measures the organization's ability to adapt to changing circumstances. A flexible culture embraces innovation and encourages experimentation, while a static culture prefers stability and predictability.
Monotonous vs. Invigorating: This continuum evaluates the level of employee engagement and motivation. An invigorating culture provides opportunities for growth and development, fostering enthusiasm and motivation, while a monotonous culture is characterized by routine and repetition.
A perfect score on these continua results in a 100th percentile ranking, indicating maximum Adaptability. Conversely, a "Stable" culture, characterized by Inward, Confrontational, Reactive, Static, and Monotonous tendencies, typically falls within the 10th to 50th percentile range. "Adaptive" cultures, demonstrating Outward, Cooperative, Proactive, Flexible, and Invigorating attributes, generally score within the 60th to 75th percentile range.
2.2. Survey Design and Data Collection:
The CPI survey comprises questions that load onto the five competing values continua and are categorized under eleven "Drivers" of culture. These drivers represent key aspects of the employee experience and organizational functioning:
Career Development
Coaching & Inspiration
Teamwork
Extrinsic Rewards
Responsibility
Connection
Decisiveness & Agency
Job Design
Strategy & Direction
Performance Improvement
Work Processes
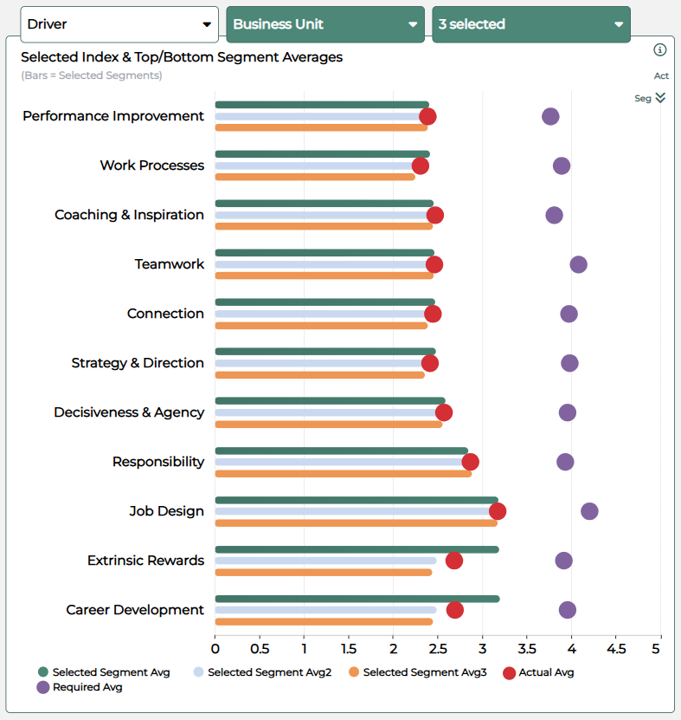
Data were collected, via survey administered on computer/smart device, from employees of the eleven Benchmark companies during February 2025. Sample sizes (n) for each company are presented in Table 1.
2.3. Data Analysis:
Survey responses were converted to percentile scores, representing the relative position of each company on the five competing values continua. Composite averages for the Benchmark companies were calculated to facilitate comparison with the normative CPI database. Statistical analyses, including t-tests and ANOVA, were conducted to determine the significance of differences between the Benchmark companies and the normative database. Additionally, correlation analyses were performed to examine the relationships between the five competing values continua and the 11 cultural drivers.
3. Results:
3.1. Macroscopic Cultural Profiles:
Table 1 presents the percentile scores for each Benchmark company and the composite average for all eleven companies.
Table 1: CPI Scores for Benchmark Companies (Percentile)

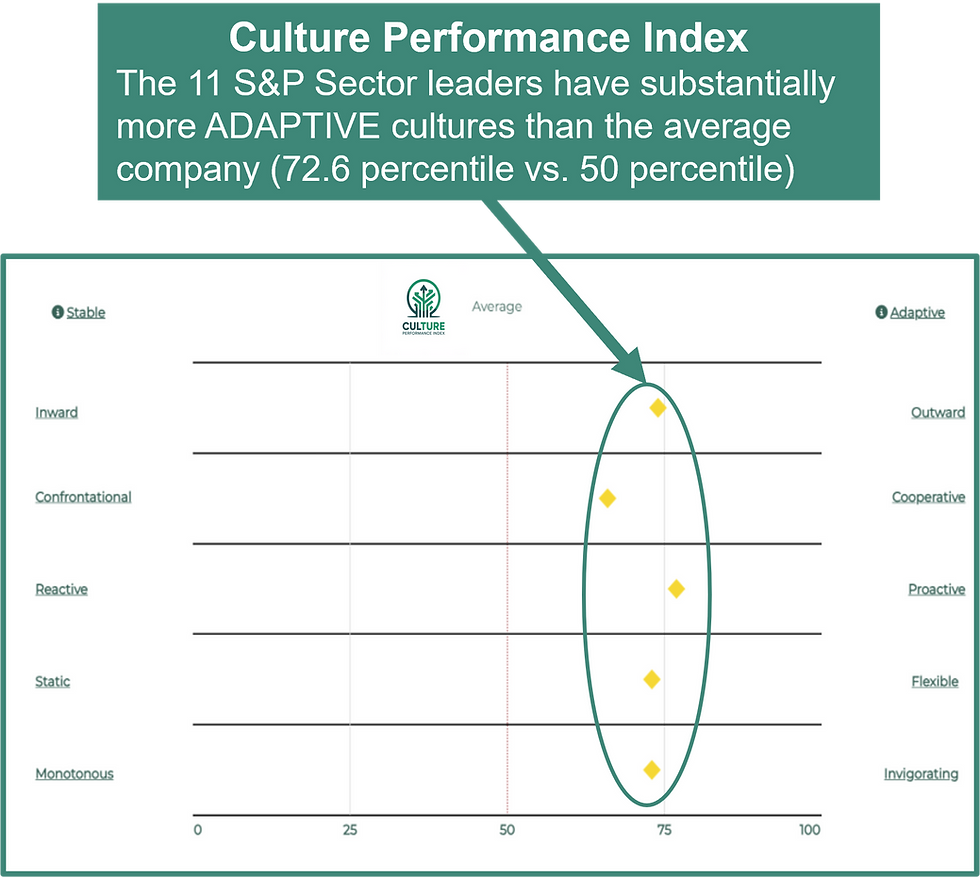
The composite average for the Benchmark companies reveals a strong tendency towards Adaptability. Notably, the Proactive dimension exhibits the highest average score (77th percentile), indicating a strong emphasis on anticipating and driving future outcomes. The Outward (74th percentile), Flexible (73rd percentile), and Invigorating (73rd percentile) dimensions also demonstrate high scores, suggesting a culture that is externally focused, adaptable, and engaging. The Cooperative dimension, while still indicating a cooperative tendency, shows the lowest average score (66th percentile).
3.2. Comparison with Normative Database:
Compared to the normative CPI database, the Benchmark companies demonstrate significantly higher scores across all five competing values continua. This indicates a greater prevalence of Adaptive cultural characteristics among the high-performing companies.
3.3. Causal Factor Analysis:
The analysis revealed that the benchmark companies consistently scored above the normative average across the big 3 Causal Factors, those factors that are most influential on organizational culture formation and maintenance. These include:
Management & Leadership
Structures, Systems & Policies
Work Design & Processes
Notably, the percentile rankings for Management & Leadership and Work Design & Processes were significantly higher, indicating a strong emphasis on effective leadership and optimized work environments.
Management & Leadership (76th percentile): This factor demonstrated the most substantial difference, suggesting that exceptional leadership practices, characterized by strong mentorship, clear strategic vision, and empathetic management, are a defining characteristic of these high-performing companies.
Work Design & Processes (75th percentile): The elevated scores in this area highlight the importance of flexible job designs, continuous improvement initiatives, and the provision of necessary resources and tools. These elements contribute to a dynamic and efficient work environment, fostering innovation and productivity.
Structures, Systems & Policies (67th percentile): While still above the normative average, the scores in this area were comparatively lower. This suggests that while these companies maintain effective systems and policies, they may not be the primary drivers of their exceptional performance.
Table 1: Causal Factor Scores (Percentile)

4. Discussion:
4.1. Findings and Implications:
The results of this study demonstrate a clear trend: companies with a higher degree of cultural Adaptability, as measured by the CPI, tend to exhibit superior financial performance. The Benchmark companies, on average, scored significantly higher than the normative database across all five competing values continua. This suggests that a culture characterized by an outward focus, collaboration, proactivity, flexibility, and an invigorating work environment is a key driver of sustained high performance.
Specifically, the high Proactive scores indicate that these companies excel at anticipating market changes and driving innovation. The strong Outward focus suggests a customer-centric approach, while high Flexibility scores reflect an ability to adapt to dynamic market conditions. The Invigorating dimension highlights the importance of employee engagement and motivation.
4.2. Potential Application – Investment Screening:
Given the observed correlation between Adaptive culture scores and company share price performance, the CPI could potentially serve as a valuable tool for investment screening. If future research consistently demonstrates a robust link, investors may consider incorporating CPI scores into their investment decision-making processes. Companies with high Adaptability scores, indicating a strong outward focus, proactive approach, and flexible mindset, may be considered for investment due to their potential for sustained growth and market resilience.
5. Limitations:
It is important to acknowledge certain limitations of this study. First, the employee sample sizes for some of the Benchmark companies were relatively small compared to their total employee populations. Therefore, individual company scores should be interpreted with caution. This limitation highlights the potential for sampling bias and may not fully capture the cultural nuances across the entire organization. However, the study employed a validated survey instrument and focused on a composite view of the Benchmark group, mitigating some of the individual sample size concerns.
Second, the Benchmark companies, while all high performers, exhibit wide variation in performance over time. They also vary widely in business models, sectors, and growth stages. This heterogeneity may influence cultural profiles and should be considered when interpreting the results.
Finally, this study establishes a correlation, not causation. Further longitudinal research is needed to determine the causal relationship between cultural Adaptability and financial performance.
5.1. Cautionary Caveats:
Several other critical caveats must be acknowledged:
Cultural Dynamics: Organizational culture is dynamic and subject to change. CPI scores represent a snapshot in time and may not reflect future cultural shifts.
Market Factors: Share price performance is influenced by numerous factors beyond organizational culture, including economic conditions, industry trends, and competitive landscapes. This study did not attempt to control for these variables.
CPI as One Factor: CPI scores should be considered as one factor among many in a comprehensive evaluation of company health and, certainly, as an investment analysis.
6. Conclusion:
This research provides compelling evidence that cultural Adaptability, as measured by the CPI, is a significant factor in sustained high performance. The emphasis on strong leadership and optimized work environments appears to be particularly critical. The focus on employee experience and the provision of tools and resources that enhance work performance is a clear trend among the benchmark companies.
While further research is needed to further establish causality and refine the model, the potential application of CPI scores as an influence on business performance and financial outcomes – and, perhaps, as an investment screening tool – warrants consideration.
Link to a copy of this
Link to this
Link to this Research Report
Connect with Author, Gerry McDonough, via eMail: gerrymcd@nextarcleadership.com


Comments